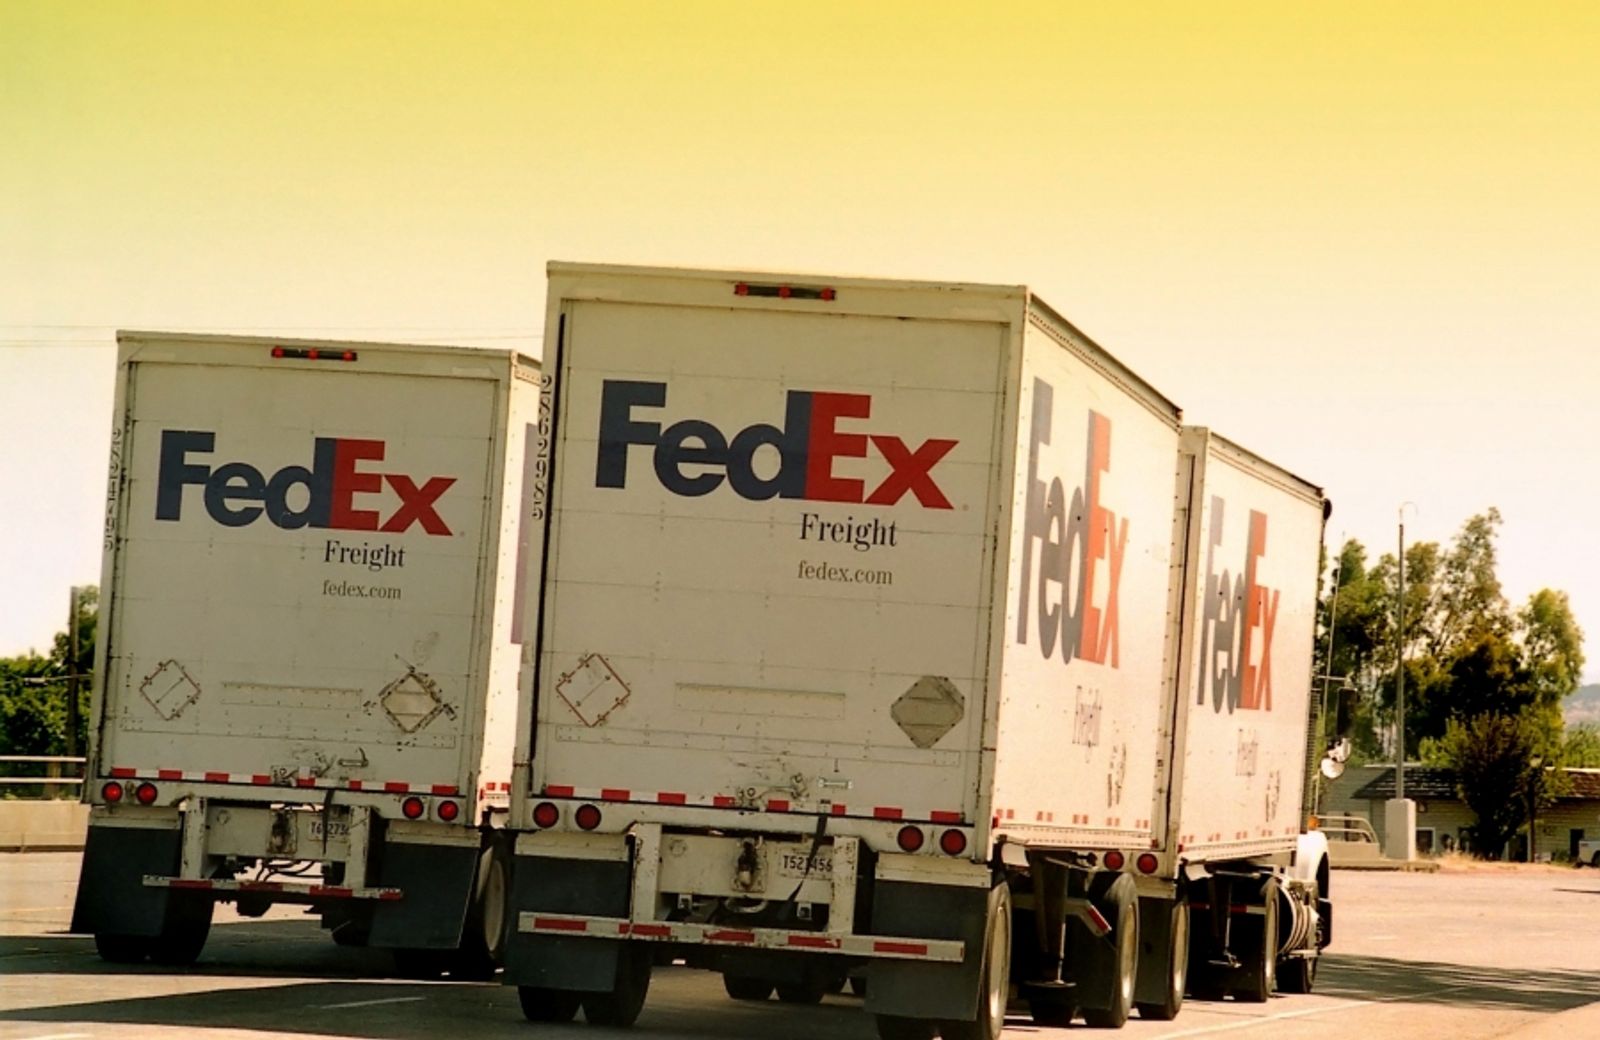
With its spin-off completed, standalone carrier FedEx Freight wants to reverse recent volume declines by filling more trailers with non-industrial freight.
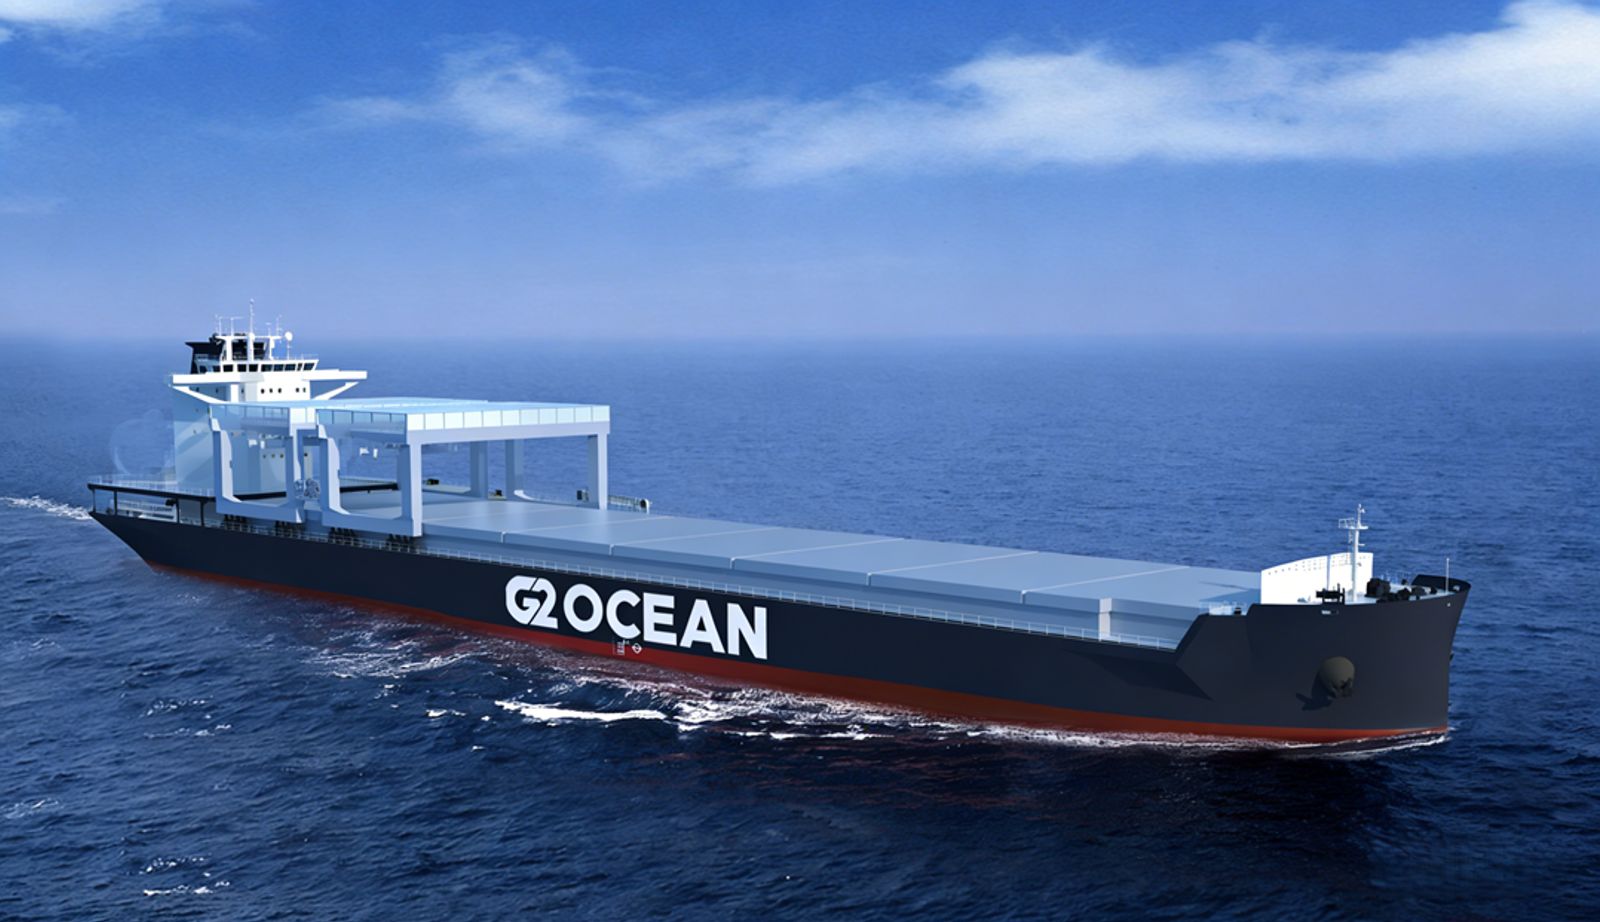
The deal is one of three orders announced recently by vessel operators which together increase the global order book for MPVs to 280 ships, equivalent to 19% of the existing fleet.
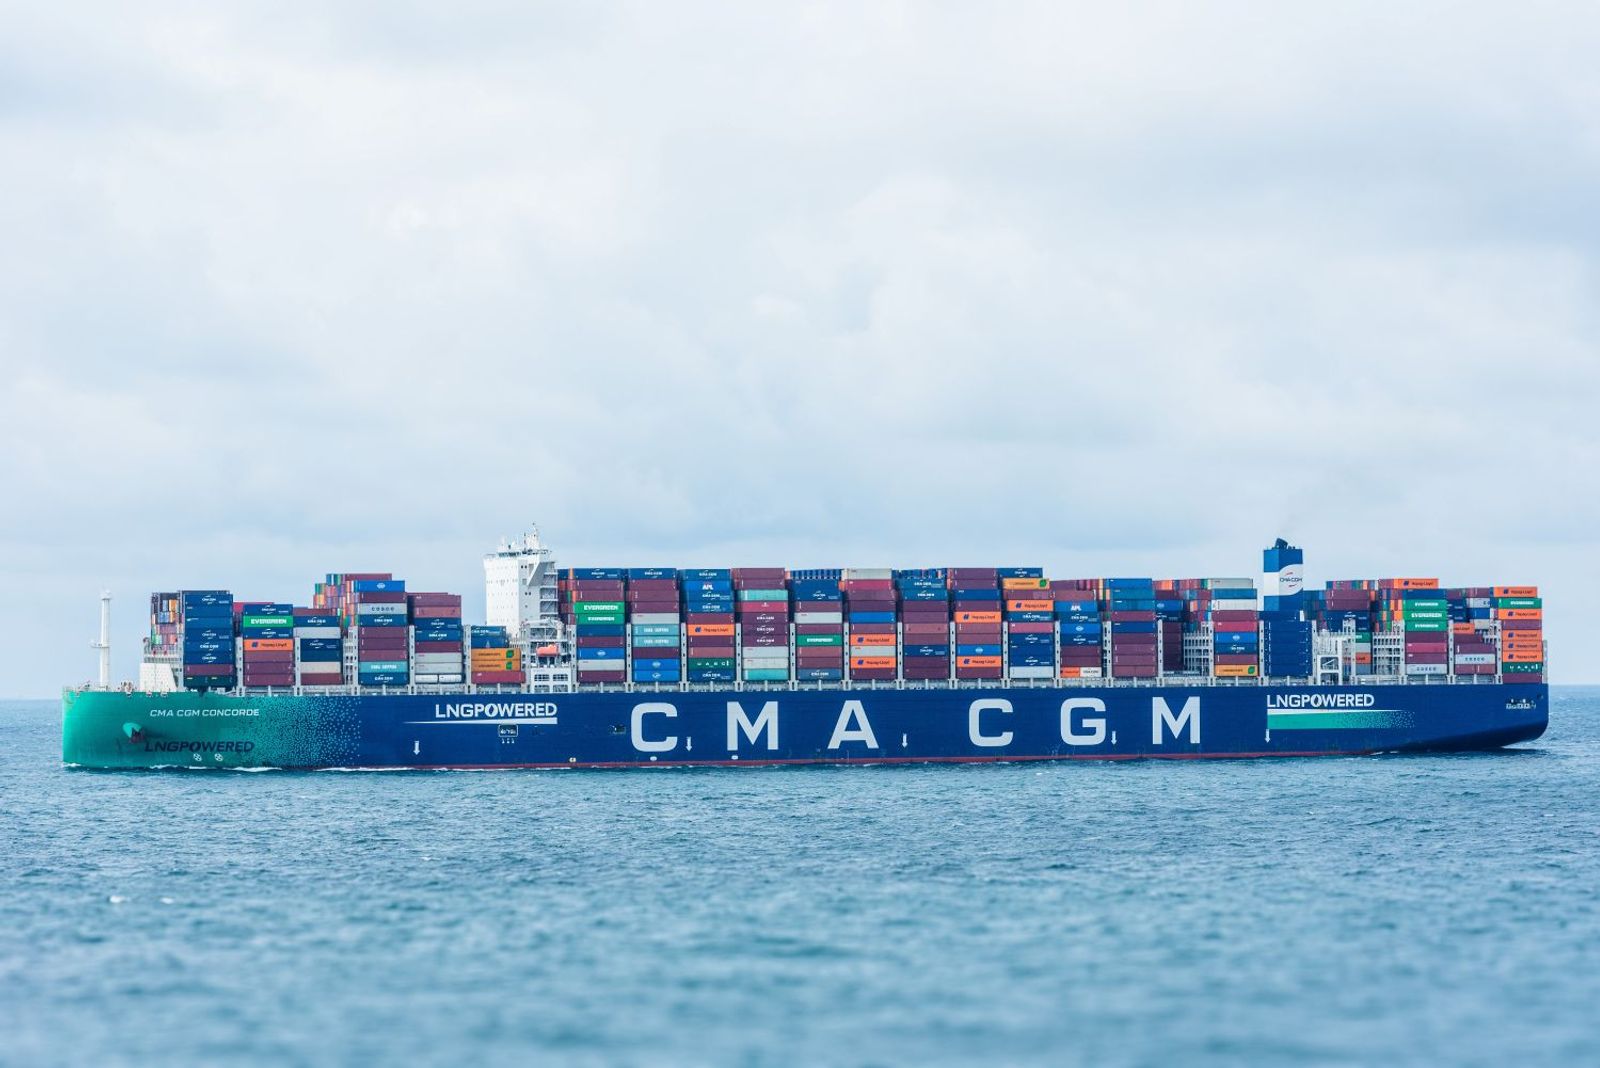
Current indications are that the normal schedule program for the “Epic” service will begin with a late-June westbound vessel departure out of India’s Nhava Sheva Port, sources say.