The funding will spur local infrastructure development at three of the 36 logistics hubs that the TradePort Corridor System aims to connect.
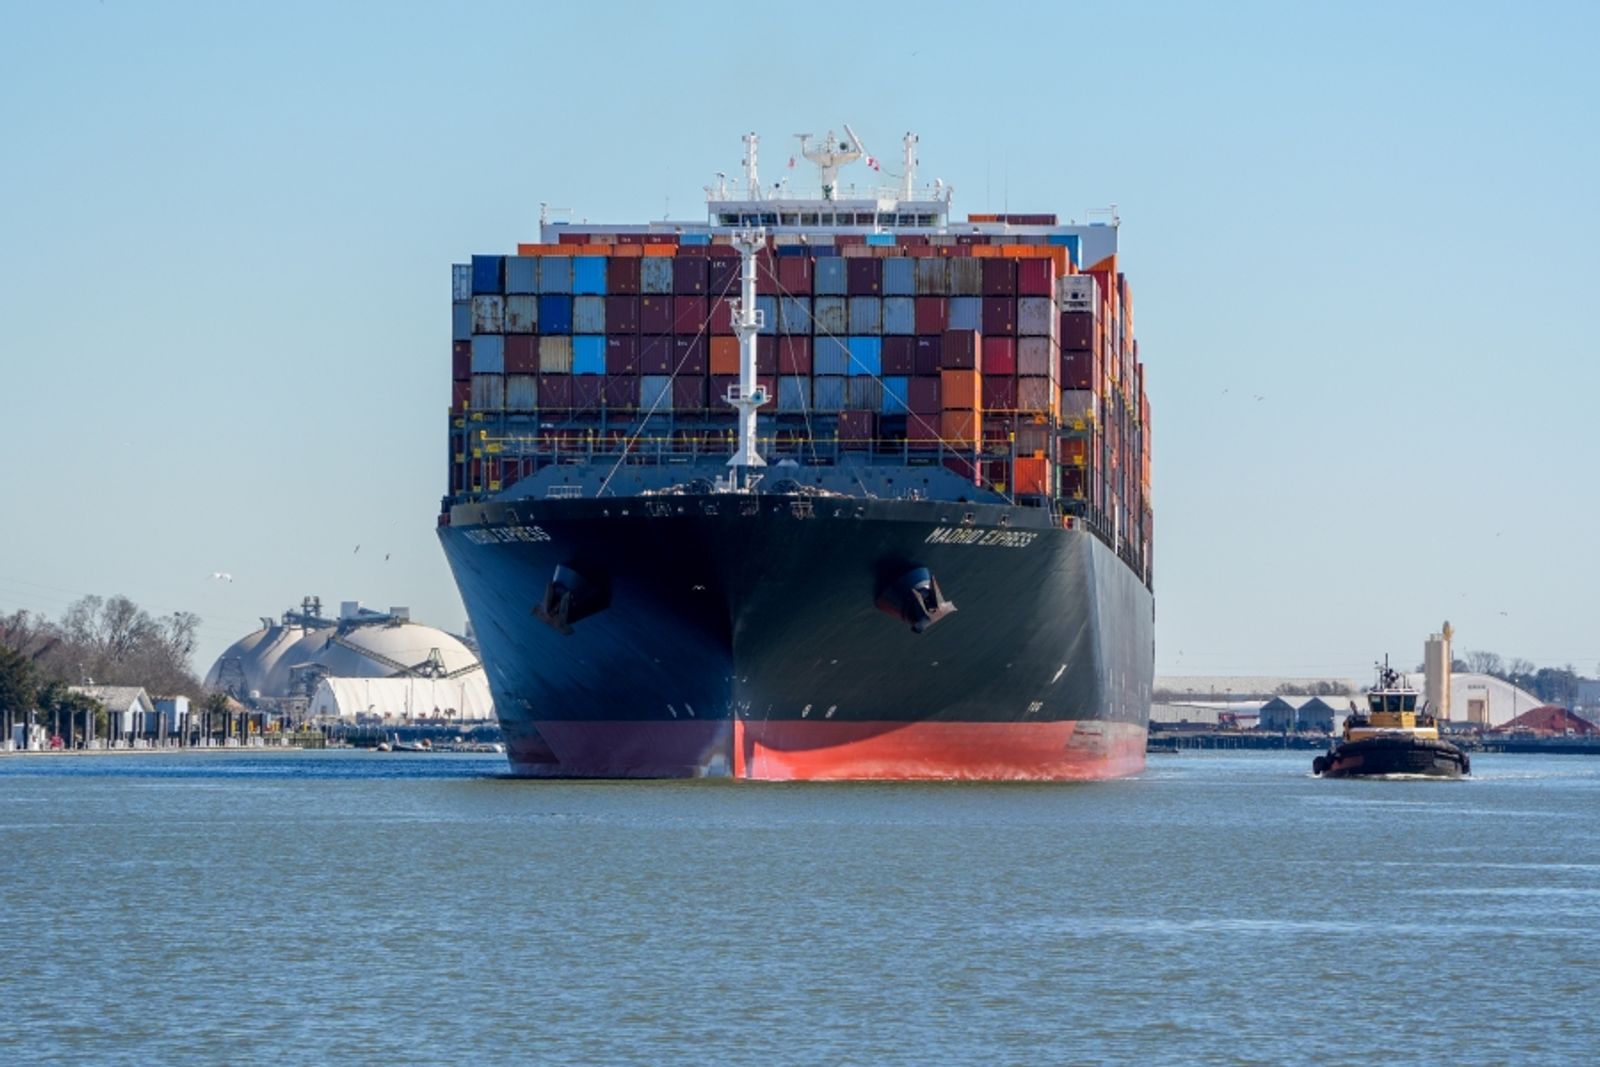
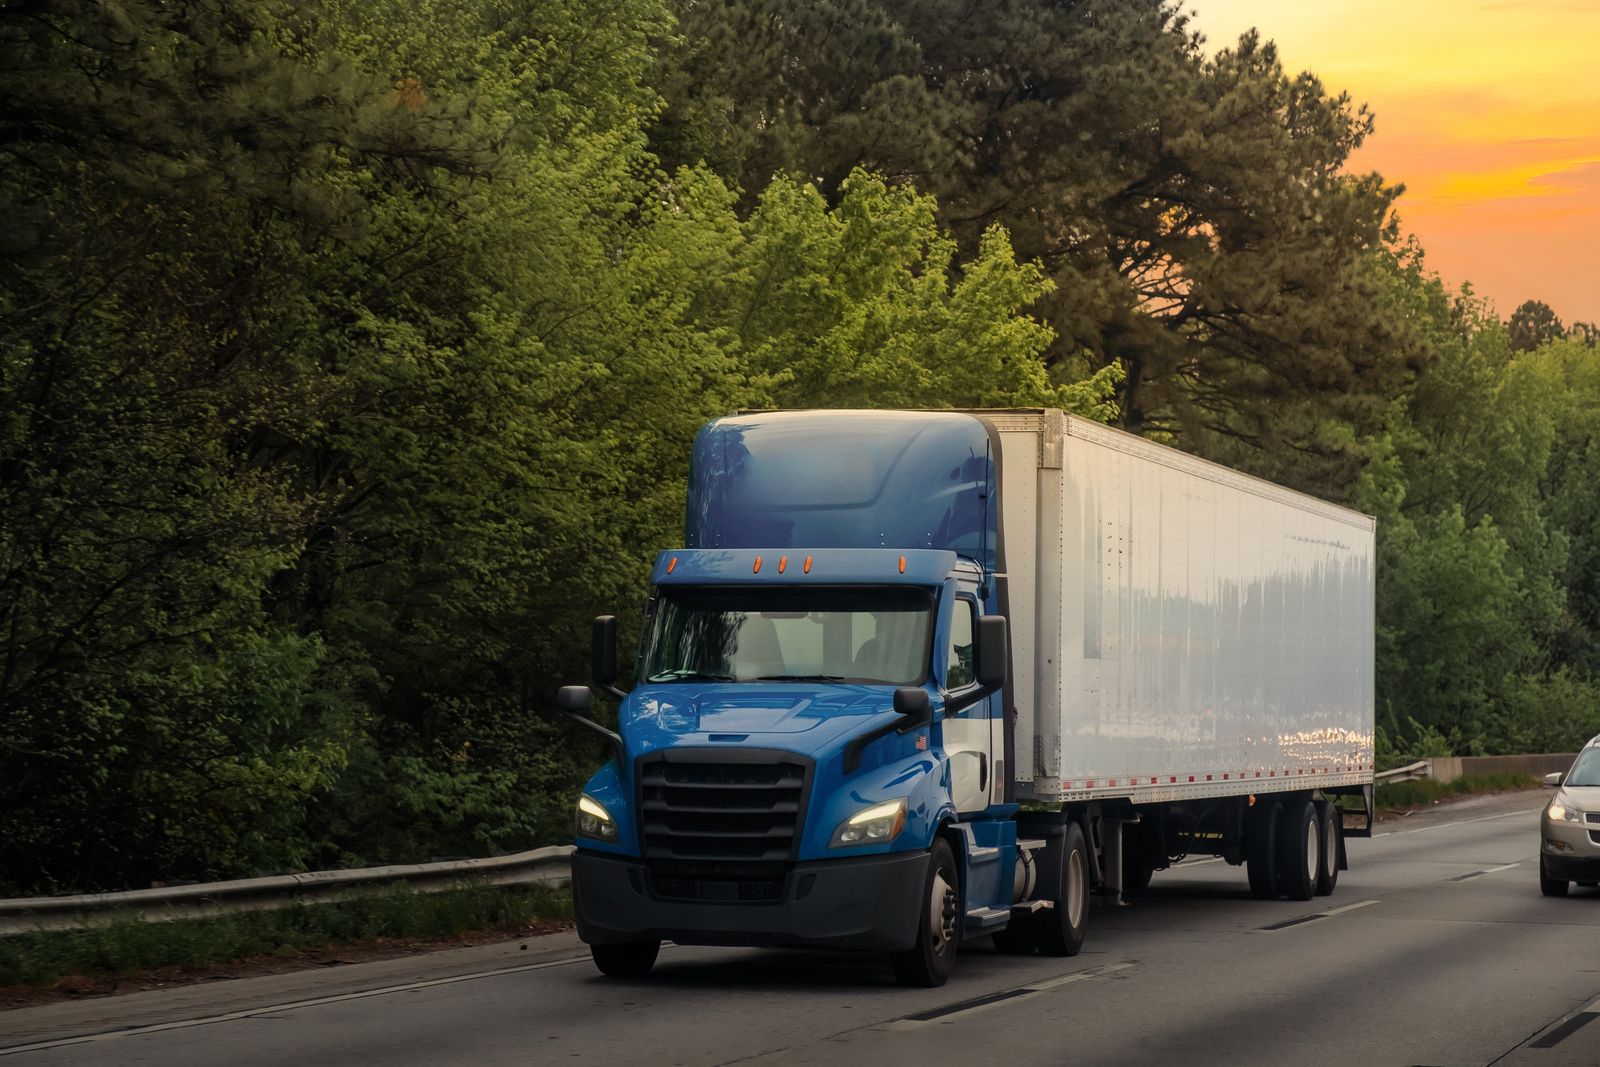
Spot truck rates from US ports are running slightly higher than national average prices, but the gap could grow in August as more imports flow inland.
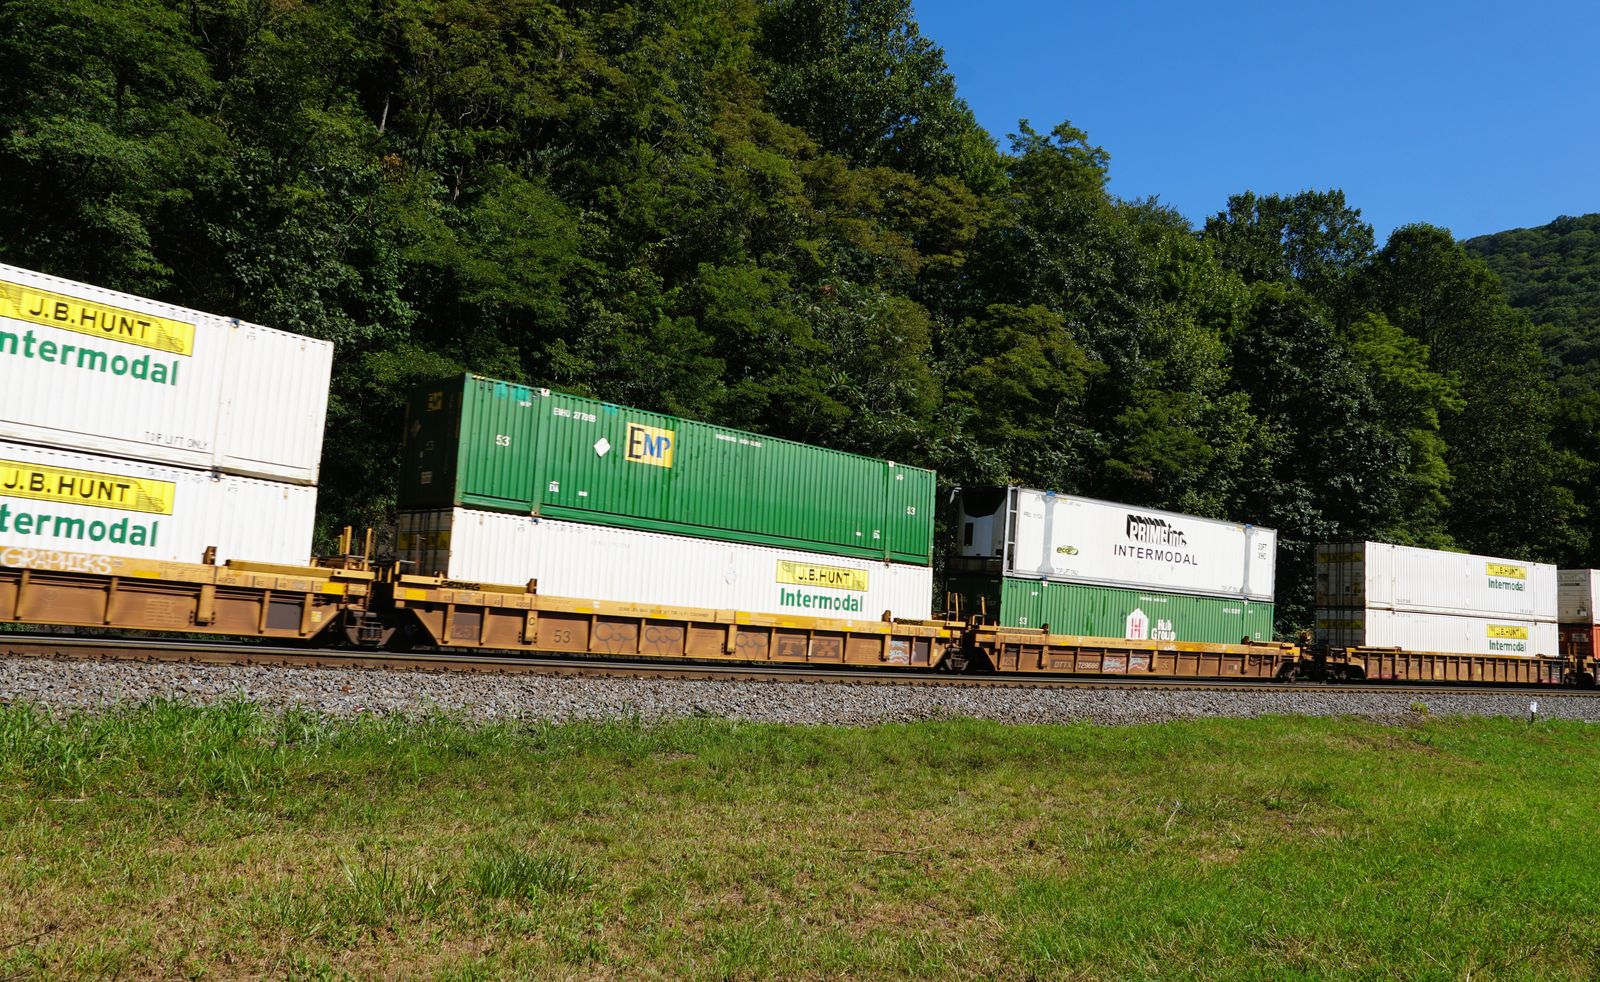
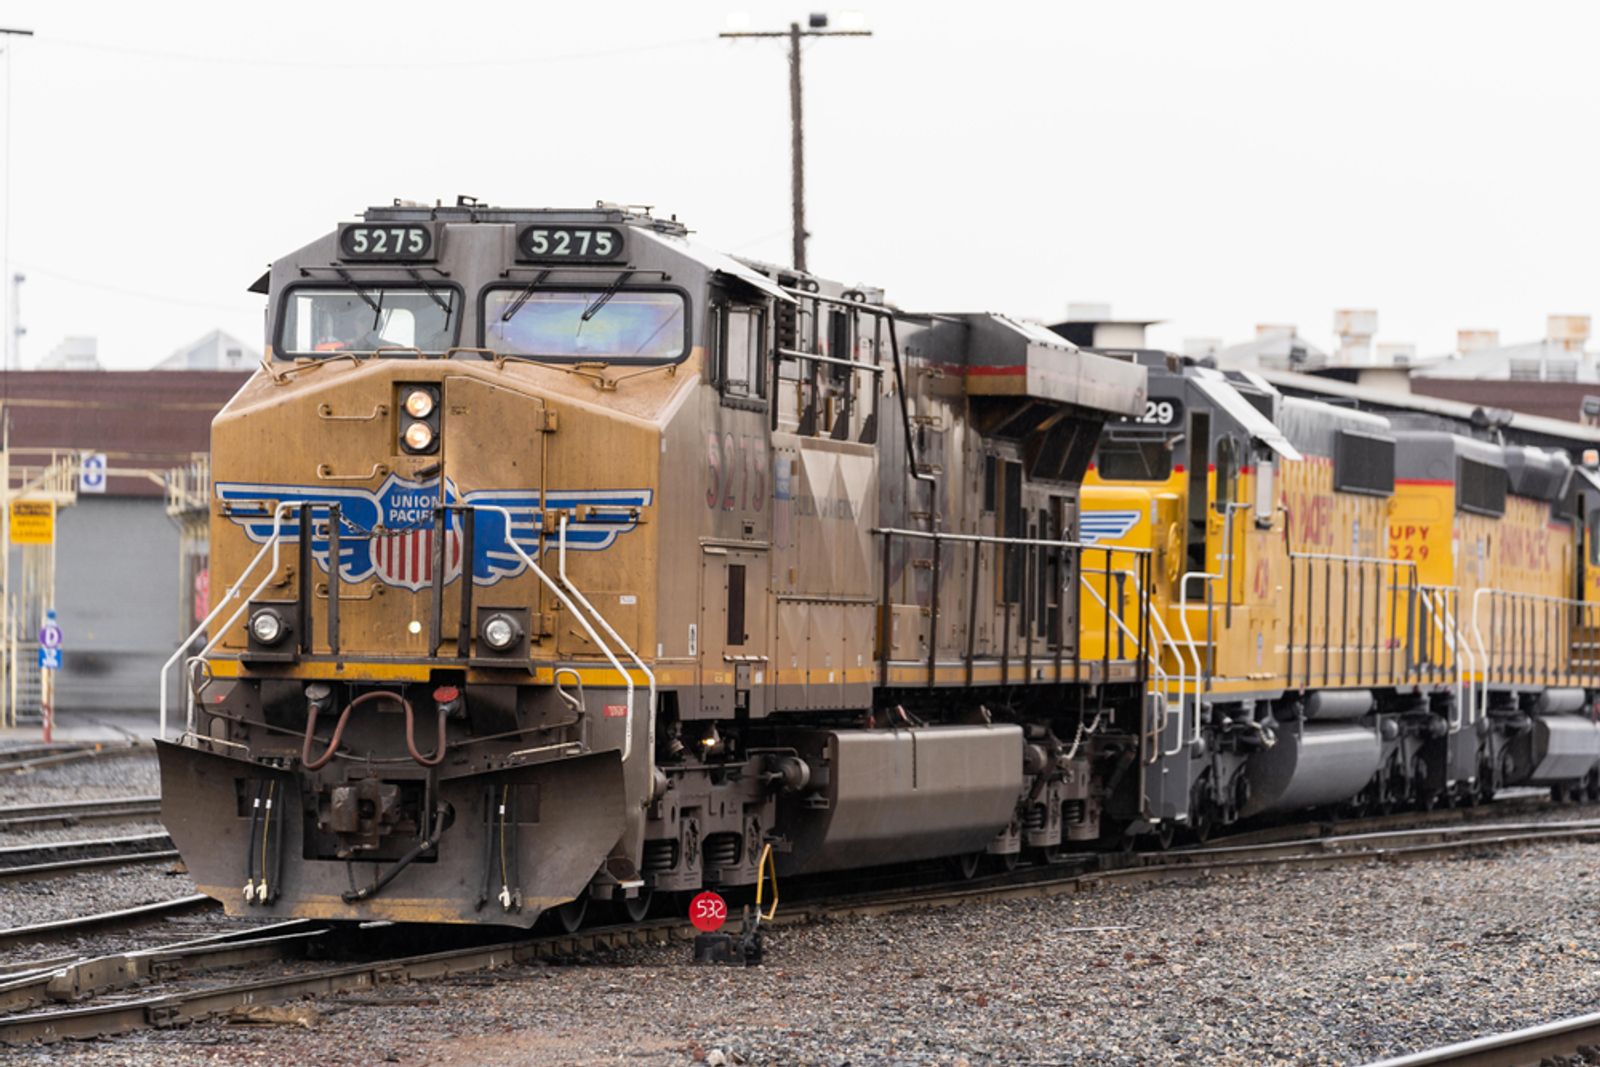
Intermodal train speeds in June were down compared with a year ago for all North American railroads except for Canadian Pacific Kansas City.